Philippe Lemoineというコーネルの博士課程にいる研究者が、自らが所属するThe Center for the Study of Partisanship and Ideology(CSPI)という組織のブログに「Have we been thinking about the pandemic wrong? The effect of population structure on transmission」と題した長文のエントリを上げ、タイラー・コーエンが「Why does R vary so much in pandemics?」というコメントを添えて リンクしている。Lemoineはツイートでその内容を解説しているので、以下にその一部を引用してみる。
However, as I argue in the post, I think it's very difficult to deny that the effective reproduction number can undergo large fluctuations even in the absence of significant behavioral changes, which is hard to understand.
Of course, there are other factors that influence transmission (such as meteorological variables), but I argue in the post that they are not sufficient to explain the large fluctuations of the effective reproduction number we observe in the absence of behavioral changes.
Since SARS-CoV-2 is a respiratory virus that is transmitted by contact, transmission should ultimately depend on people's behavior, this is very puzzling. So how can we explain those fluctuations of the effective reproduction number without denying this basic fact?
What I propose in the post is that we can square this circule by taking into account population structure and how it can affect transmission even in the absence of behavioral changes.
Indeed, standard epidemiological models, of the sort that are used to make projections and study the impact of non-pharmaceutical interventions, assume that the population is homogeneous mixing or something close to it.
What this means is that models assume that someone who is infectious has the same probability of infecting everybody in the population or, since models used in applied work often divide the population into age groups, the same probability of infecting everyone in their age group.
Of course, this is totally unrealistic, since in practice if I'm infectious the probability that I'll infect most people in the population or even in my age group is effectively zero, because I don't even have any interaction with them and therefore couldn't possibly infect them.
In practice, the virus doesn't spread in a homogeneous population, but on a network based on people's patterns of interaction with each other. The topology of that network determines what paths the virus can take to spread on the population and not all paths are equally likely.
Now, suppose that this network can be divided into subnetworks that are internally well-connected, but only loosely connected to each other.
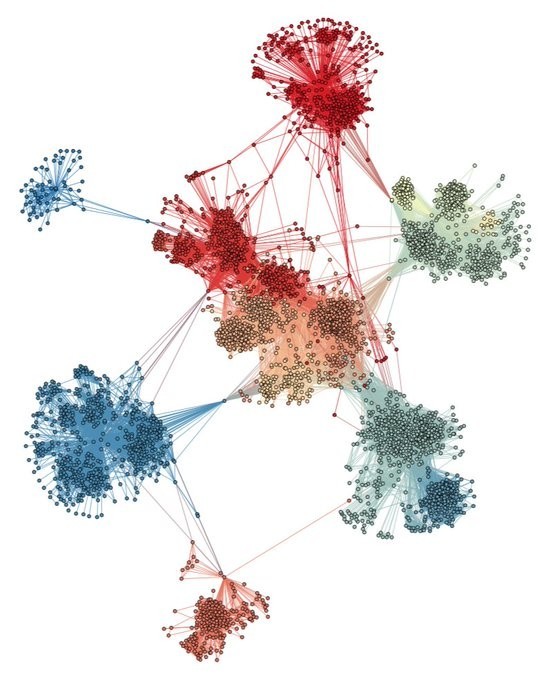
In network science, a network that has this property is said to have "community structure", which many real networks are observed to have. For instance, here is a network based on friendship relationships among a few thousand people on Facebook, which has this kind of structure.
If the population has that kind of structure, when one of the subnetworks is seeded, the virus starts spreading in that subnetworks until herd immunity is reached locally, at which point incidence goes down unless the virus manages to reach another subnetwork from there.
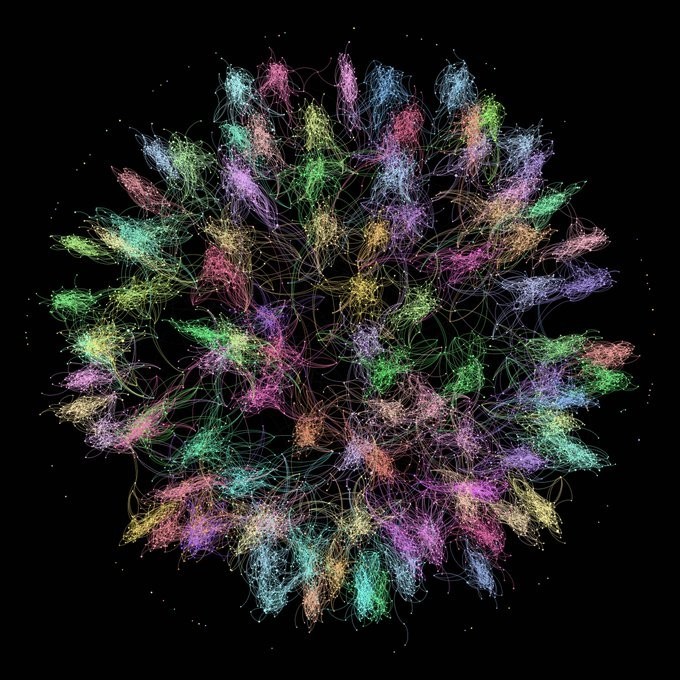
Thus, instead of simulating the spread of the virus on a network of individuals, I simulate the spread on a network of homogeneous mixing populations that has community structure. Here is a graph that shows the network generated by the model for one of my simulations.
At the level of each subpopulation in the network, the model is a standard epidemiological model that assume homogeneous mixing, but people who are infected in one subpopulation can "travel" to another along the edges of the network and infect people over there.
(I put "travel" in scare quotes because people in different subpopulations may nevertheless be neighbors. What matters is who they interact with, not physical proximity, though obviously they are related. I discuss this point in more detail in the post.)
As you can see, the network is divided into subnetworks that are internally well-connected, but loosely connected to each other. Moreover, each edge is associated with a probability of "travel" along that edge, which is much greater for edges that stay within the same subnetwork.
For this simulation, I assumed a probability of "travel" of 5% along the edges that stay within the same subnetwork, but only 1 in 10,000 for edges that lead to a subpopulation in another subnetwork. There are more than 10,000 subpopulations, for a total population of ~5 million.
Here is a chart that shows the result of the simulation when I let the virus spread on that network. As you can see, the effective reproduction number undergoes wild fluctuations and the population experiences several waves at the aggregate level.
However, at the level of each subpopulation, the basic reproduction number was assumed to remain constant! Thus, this shows that, when the population has that kind of structure, the effective reproduction number can undergo large fluctuations even without any behavioral changes.
In order to make the process more intuitive, I created this animation showing how the virus spreads across subpopulations, which are represented by rectangles whose area is proportional to their size inside larger rectangles that represent the subnetworks to which they belong.
Unsurprisingly, if we increase the connectivity between subnetworks enough, the model behaves in a way that is more similar to what happens in a homogeneous mixing population.
For instance, if I use the same method to randomly generate a network but multiply the average number of edges between subnetworks by 10 and the probability of "travel" associated to those edges by 100, I obtain this epidemic.
Simulations on networks with community structure can produce all sort of epidemics, not just epidemics with large, sharply defined waves as above, but also epidemics that exhibit long plateaus with ups and downs. Just as we see in real data.
Thus, by relaxing the assumption of homogeneous population mixing and simulating the spread of the virus on a network with community structure, we can get the sort of behavior that we observe in the real world even with a constant basic reproduction number in each subpopulation.
(拙訳)
しかしながら、エントリで論じたように、行動の顕著な変化が無くても実効再生産数が大きく振れることがあるのを否定するのは非常に難しいと思う。この現象を理解するのは困難である。
もちろん、感染に影響する要因は(気象変数など)他にもあるが、エントリで論じたのは、行動の変化が無い場合に我々が観測する実効再生産数の大きな振れを説明するのにそれらは十分ではない、ということである。
SARS-CoV-2は接触感染する呼吸器系のウイルスであり、感染は結局は人々の行動に依存するはずなので、この現象は非常に不思議である。基本的な事実を否定することなしに実効再生産数のこの振れをどのように説明できるだろうか?
エントリで私が提案したのは、人口構造と、行動の変化が無い場合でもそれがどのように感染に影響するか、を考慮に入れれば、この難題を解決できる、ということである。
実際のところ、予測や非医薬的措置の効果の研究に使われるような標準的な疫学モデルでは、人口は均一な混合物ないしそれに近いものと仮定されている。
そのことが意味するのは、感染した人が人口の誰かに感染させる確率は皆等しい、とモデルが仮定している、ということである。あるいは、応用研究では人口を年齢層に分けることが多いので、その年齢層で誰かに感染させる確率は皆等しい、とモデルが仮定している、ということである。
もちろんこれは完全に非現実的である。実際には、私が感染したら、人口の大半、もしくは同じ年齢層の人の大半でさえ、私が感染させる確率は事実上ゼロである。というのは、彼らとは一切関わりがなく、従って感染させ得ないからである。
実際にはウイルスは均一な人口に広がるのではなく、人々の相互の関わりのパターンに基づくネットワークの上で広がる。そのネットワークのトポロジーが、ウイルスが人口に広まる際に採り得る経路を決定し、すべての経路の確率は同じではない。
このネットワークが、内部での接続は強いが、お互いの接続は弱い副ネットワークに分割することができるとしよう。
ネットワーク科学では、このような特性を持つネットワークは「共同体構造」を持つ、と言われ、実際のネットワークの多くがその特性を持っていることが観測されている。例えば、以下はフェイスブックの数千の人々の友だち関係に基づくネットワークであるが、そうした構造を持っている。
人口がこのような構造を持っている場合、副ネットワークの一つに種が蒔かれれば、ウイルスはその副ネットワークに広がり始め、それは局所的な集団免疫が達成されるまで続く。ウイルスがそこから他の副ネットワークに到達しない限り、その時点で感染は収束する。
ということで私は、個々人のネットワーク上でウイルス拡散をシミュレートする代わりに、共同体構造を持つ均一混合人口のネットワーク上でシミュレートした。私のシミュレーションの一つでモデルが生成したネットワークを示すグラフは以下の通り。
ネットワークのそれぞれの副人口のレベルでは、モデルは、均一混合を仮定する標準的な疫学モデルである。しかしある副人口の感染者はネットワークの枝に沿って別の副人口に「旅行」することができ、そこの人々に感染させることができる。
(「旅行」を鍵括弧に入れたのは、異なる副人口の人々が実は近所だということがあり得るからである。重要なのは誰と関わるかであり、物理的な近さではない。とは言え、その2つが関連しているのは明白である。この点はエントリでより詳細に論じた。)
見て分かるように、ネットワークは、内部での接続は強いが、お互いの接続は弱い副ネットワークに分割されている。また、それぞれの枝はその枝に沿って「旅行する」確率と関連しているが、同じ副ネットワーク内の枝ではその確率はかなり高い。
このシミュレーションのため私は、同じ副ネットワーク内の枝に沿って「旅行」する確率を5%としたが、他の副ネットワークの副人口につながる枝については1万分の1とした。副人口は1万以上あり、総人口は約500万である。
このネットワークでウイルスを拡散させたシミュレーション結果のグラフは以下の通り。見て分かる通り、実効再生産数は大きく振れ、人口は全体レベルで幾つかの波を経験する。
しかしそれぞれの副人口レベルでは、基本再生産数は一定に留まると仮定しているのである! ということで、このことが示しているのは、人口にこうした構造がある場合、行動が何も変化しなくても実効再生産数は大きく振れることがある、ということである。
この過程をより直観的に分かりやすくするため、ウイルスが副人口間でどのように拡散するかを示す以下のアニメーションを作成した。副人口は面積が人口規模に比例する長方形で表されており、所属する副ネットワークを表すより大きな長方形の中にある。
twitter.comIn order to make the process more intuitive, I created this animation showing how the virus spreads across subpopulations, which are represented by rectangles whose area is proportional to their size inside larger rectangles that represent the subnetworks to which they belong. pic.twitter.com/iUVQB0euVJ
— Philippe Lemoine (@phl43) 2021年11月22日
驚くべきことではないが、副ネットワーク間の接続性を十分に高めれば、モデルは均一混合人口での振る舞いに近くなる。
例えば、副ネットワーク間の平均の枝数を10倍、それらの枝における「旅行」確率を100倍にして同じ手法でネットワークをランダムに生成すると、以下の疫病が得られる。
共同体構造を持つネットワークでのシミュレーションは、あらゆる種類の疫病を生成できる。上のような輪郭のはっきりした大きな波だけでなく、上下を伴う長期の高原状態を示す疫病も、である。それは実際のデータで我々が目にするものと全く同じである。
従って、均一混合人口の仮定を緩め、共同体構造を持つネットワークでの拡散をシミュレートすることにより、各副人口における基本再生産数を一定に保ちつつも、実世界で観測されるような振る舞いを得ることができるのである。


感染の不均一性が現実のコロナ禍の理解において重要、という話は昨年から取り沙汰されてきた話であるが(cf. ここ、およびそのリンク先)、Lemoineはエントリ本文の追記で、今回の話とその話の違いを以下のように解説している。
Based on the response to this post, many people seem to think what I’m saying is the same thing as what people who argued back in 2020 that heterogeneity in social activity might lower the herd immunity threshold, but while this is related to what I’m talking about here it’s actually different so I thought it might be useful to briefly explain why. I’m actually familiar with the debate that took place about that last year, since I even wrote a post about it at the time. In both cases, the point is that heterogeneity affects the dynamic of the epidemic, but it’s not the same kind of heterogeneity. What people were arguing last year is that, if people’s level of social activity varies a lot, herd immunity will be reached sooner because the people who spread the virus the most are also the most likely to be infected early in the pandemic.41 This intuitive argument is supported by models showing that, when you introduce that kind of heterogeneity, herd immunity does in fact occur sooner. If we model the spread of the virus on a network, this debate was mostly about the degree distribution, i. e. the distribution of the number of edges connected to each individual in the network. The point was that, when this distribution is more dispersed than standard epidemiological models implicitly assume, the herd immunity threshold will be lower than predicted by those models.
However, the kind of epidemic behavior I discuss in this post only arises when the network has community structure, which is about a lot more than the variance of the degree distribution.42 In particular, the network must exhibit a specific kind of clustering, but this doesn’t just depend on its degree distribution. In fact, it’s conceivable that at the level of the parts of the network that I idealized as homogeneous mixing population in my simulations, the herd immunity threshold is lower than predicted by standard epidemiological model due to heterogeneity in social activity, even though at the aggregate level it’s higher due to community structure, as I explained above. So while most people have interpreted the fact that many places with a high prevalence of immunity have recently experienced large outbreaks as proof that people who argued that heterogeneity in social activity could lower the herd immunity threshold were wrong, this is not actually the case if the network on which the virus is spreading has the kind of structure assumed in this post. Of course, like the rest of this post, this is very speculative, but it goes to show that the spread of infectious diseases is a lot more complicated than people generally assume.
(拙訳)
このエントリへの反応を見ると、私の言っていることは、社会活動の不均一性が集団免疫の閾値を下げるかもしれないと2020年に人々が論じていたのと同じこと、と多くの人が考えているようである。しかし、その話はここで私の言っていることと関連はしているものの、実際には違う。その理由を簡単に説明するのは有益かと思われる。昨年のその議論については私もよく知っているが、というのは当時それについてエントリを書いてさえいるからだ。いずれのケースでも、不均一性が疫病の動学に影響することがポイントとなっているが、両者の不均一性は同じものではない。昨年人々が論じていたのは、人々の社会活動の水準のばらつきが大きければ、集団免疫は早く達成できる、ということである*1。そうした不均一性を導入すれば実際に集団免疫は早く達成される、ということを示したモデルにより、この直観的な議論は支持された。ウイルスのネットワーク上での拡散をモデル化する場合、この議論は主に次数分布、即ち、ネットワークで個人が互いに接続されている枝の数の分布に関する話となる。そこでのポイントは、この分布が標準的な疫学モデルが暗黙裡に仮定しているよりも分散しているならば、集団免疫の閾値はそれらのモデルが予測するよりも低くなる、ということである。
しかし、私が本エントリで論じている疫学的振る舞いは、ネットワークが共同体構造を持っている場合のみ生じる。それは次数分布の分散よりもかなり広い話である*2。具体的には、ネットワークはある種のクラスタリングを示す必要があるが、これは次数分布だけに依存するわけではない。実際、私がシミュレーションで均一混合人口として理想化したネットワークの部分レベルでは、集団免疫の閾値は社会活動の不均一性によって標準的な疫学モデルが予測するよりも低くなる。上で説明したように、共同体構造のために全体レベルでは閾値は高くなるにもかかわらず、である。免疫が普及した多くの場所で最近大規模なコロナ禍が生じたことを、社会活動の不均一性が集団免疫の閾値を下げると論じた人が間違っていたことを証明した、と多くの人は解釈したが、ウイルスが拡散しているネットワークが本エントリで仮定したような構造を持っていたとしたら、それは必ずしもそうではない。もちろん、エントリの他の部分と同様、これはまったく推測の域を出ない話であるが、感染症の拡大は人々が一般に想定するよりも遥かに複雑であることを示す話ではある。
*1:原注:Actually, some people also talked about other kinds of heterogeneity, such as heterogeneity in susceptibility. If you are modeling the spread of a virus on a network, whose edges have a weight indicating the probability of transmission along that edge, this presumably depends on a combination of the degree distribution and the distribution of the weights. But this is also different from the kind of heterogeneity I’m discussing in this post.
(拙訳)
実際には、感受性における不均一性など、他の種類の不均一性について論じた人もいた。枝に沿った感染確率を示すウエイトを備えたネットワークでウイルス拡散をモデル化する場合、これは次数分布とウエイトの分布との組み合わせに左右されると思われる。しかしそれは本エントリで私が論じている不均一性とはやはり違う。
*2:原注:In general, the topology of a network can’t be reduced to the properties of its degree distribution, because it depends on facts about how the network was generated that go beyond the degree distribution that was used.
(拙訳)
一般にネットワークのトポロジーは次数分布の特性に還元できない。ネットワークがどのように生成されたかという、使われた次数分布を超えた話に依存するからである。