ムーアの法則からエルームの法則へ:電力制約と生産性の鈍化

というNY連銀スタッフレポートにタイラー・コーエンがリンクしている*1。原題は「From Moore’s Law to Eroom’s Law: Power Constraints and the Productivity Slowdown」で、著者はPablo Azar。
以下はその要旨。

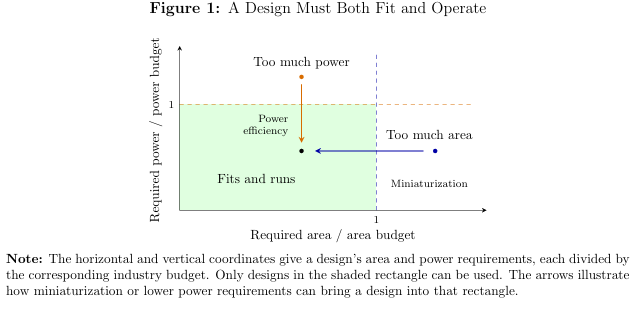
Economic growth depends on combining existing inputs into new inventions. However, these combinations are not always physically feasible. One important example is dark silicon, where power and cooling limits prevent all the transistors on a chip from operating at once. I develop a growth model motivated by these limitations and establish conditions for a unique balanced growth path where electronic miniaturization and power efficiency grow at the same rate. When power-efficiency research becomes harder, both total research employment and productivity growth fall on the new balanced growth path. With gradual adjustment of research employment, I construct a local equilibrium transition in which more researchers temporarily coexist with slower productivity growth. This Eroom’s law result holds for small shocks in a two-dimensional design space with sufficiently similar industry constraints.
(拙訳)
経済成長は、既存の投入を新たな発明に結び付けることに依存する。しかし、そうした結び付きは常に物理的に可能とは限らない。一つの重要な例は、電力と冷却の限界がチップ上の全てのトランジスタが一度に機能するのを妨げるダークシリコン*2である。こうした限界を動機付けとして私は、成長モデルを開発し、電子部品の小型化と電力の効率が同じ割合で成長するユニークな均衡成長経路の条件を明らかにした。電力効率の研究が難しくなると、新たな均衡成長経路では、総研究雇用と生産性成長が共に低下する。研究雇用が徐々に調整される場合における、より多くの研究者がより鈍化した生産性成長と共存する局所均衡遷移を私は構築した。このエルームの法則*3の結果は、十分に似たような業界の制約がある2次元の設計空間における小さなショックについて成立する。

以下は論文の図。

デナード則*4が働いているうちは、ある電子的機能について、サイズと必要電力が同じ割合で低下していく唯一の均衡成長経路が存在する。その割合が一定になるのは、よりきつい制約の方に研究が対応するからである。しかし、デナード則が終焉すると、研究における電力効率のシェアが大きくなり、新たな均衡成長経路では研究雇用全体と生産性成長が低下する。より困難な問題が研究のシェアを奪うものの、研究の労働力人口そのものが縮小するため、その研究活動に従事する研究者が増えるとは限らない。小型化が継続しても、電力制約が多くの新たに小型化された設計の利用を阻むため、そうした損失を完全に埋め合わせることはできない。
ただ、十分に小さなショックがあると、生産性成長は以前より低いままだが、総研究雇用がショック以前の水準を一時的に超える、ということがあり得る。そうした局所均衡では、エルームの法則が成立する。既存の電力研究プロジェクトが縮小する中で、新たな小型化の研究者が参入する。その均衡も最終的には、研究者雇用と生産性成長が共に低くなる新たな均衡成長経路に収束する。

キャッシュ・ミー・イフ・ユー・キャン:ATM爆破、支払いの選択、および消費

という論文をMichael Weberらが1年半前に書いている。原題は「Cash me if you can: ATM explosions, payment choice, and consumption」で、著者はEsad Smajlbegovic(エラスムス・ロッテルダム大)、Theresa Spickers(アムステルダム第)、Daniel Urban(エラスムス・ロッテルダム大)、Michael Weber(シカゴ大)。
以下はその要旨。

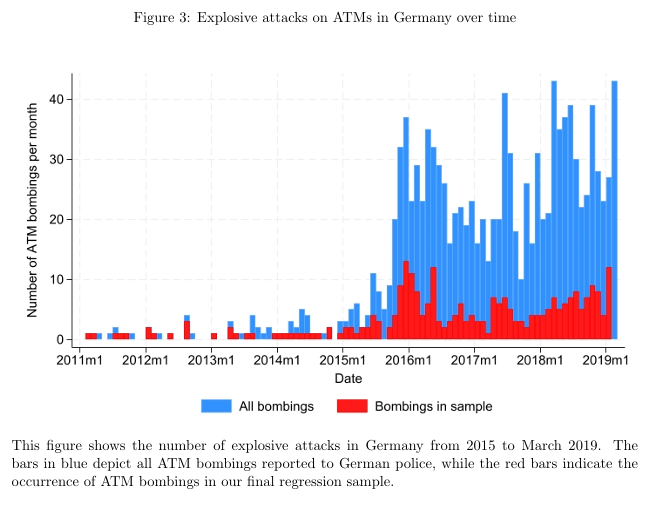
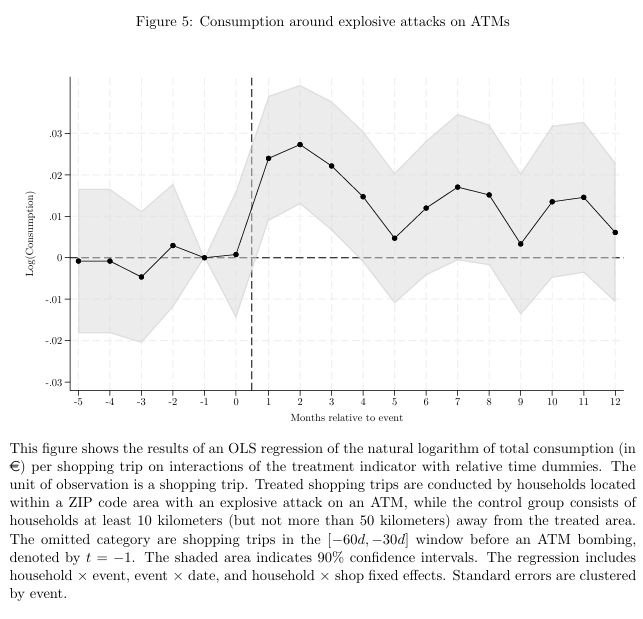
We study the consumption effects of a shift from cash to card payments. We exploit 275 explosive attacks on automated teller machines (ATMs) in Germany, which provide plausibly exogenous variation in the availability of cash. Using home scan data, we find that households increase their consumption by 2.3% after an ATM in their vicinity is attacked. Purchases of more expensive, branded products, and temptation goods drive the increase in spending, and the effect largely dissipates after 3 months. Payment diaries from survey data suggest a significant long-term rise in card payments following explosive attacks. Overall, the results are consistent with short-term overspending as consumers transition to digital payments.
(拙訳)
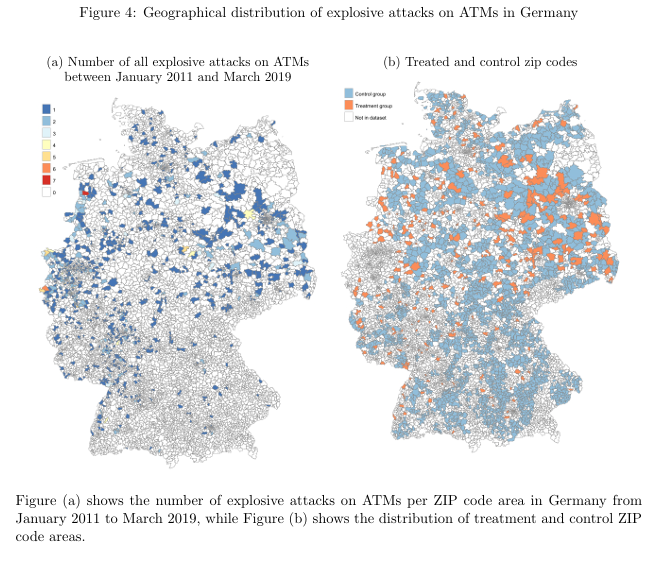
我々は現金からカードへの支払いの変化による消費への効果を調べた。ドイツでの現金自動預け払い機(ATM)への275件の爆破襲撃事件*1を我々は利用した。これは現金の利用可能性について外生的と説得力を以って考えられる変動を提供する。ホームスキャンデータを用いて我々は、近隣のATMが襲撃された後、家計が消費を2.3%増やすことを見い出した。より高価なブランド品と誘惑財*2の購入が支出の増加をもたらしており、その効果は3か月後には概ね消失する。調査データでの支払い記録が示すところによれば、爆破襲撃事件の後にカード支払いが有意に長期的に増加した。総じて、以上の結果は、消費者がデジタル支払いに移行すると短期的に過度に支出する、ということと整合的である。

以下は論文の図1~5。

*1:cf. ATM爆破による現金強奪、ドイツが格好の標的にされる理由とは(1/2) - CNN.co.jp、現金派が多いから? ドイツではATMを爆破する強盗が相次いでいる | Business Insider Japan]。

*2:本文では「We define temptation goods as lemonade, sweets and snacks, desserts, cake, pizza, and related snacks stored in the freezer.」と定義している。こちらのバナジーらの論文では、「Temptation goods are defined to be the set of goods that generate positive utility for the self that consumes them, but not for any previous self that anticipates that they will be consumed in the future.」「In our framework, the donut or the cigarette represents a temptation good. In the moment we would spend money on it. But we would like future selves to not spend money on it. Temptation goods give us utility in the moment but it is not utility we care for when considering future selves.」と定義している。

20年の研究の後の2000年代の住宅循環の再評価

というNBER論文が上がっている(ungated版)。原題は「Reassessing the 2000s Housing Cycle After Two Decades of Research」で、著者はAdam Guren(ボストン大)。
以下はその要旨。

What caused the 2000s housing cycle? This article synthesizes two decades of research, including reduced-form empirics and structural models. Although often contentious, the literature coheres once one accounts for each study’s timing, place, methodology, and measurement. The cycle was a perfect storm that occurred in distinct stages. Starting in the late 1990s, fundamentals improved, and credit supply increased across the income distribution due to automated underwriting and financial deregulation. In the early 2000s, a decline in interest rates was followed by a further expansion in securitized and subprime credit, the origin of which remains controversial. This sequence of shocks produced a persistent boom that triggered two shifts in beliefs: average expectations became overly optimistic, pushing prices higher, and expectations diverged, fueling speculation. In the bust, prices overshot primarily due to mortgage defaults, which removed buyers and contracted credit supply. How these forces interact and how expectations form require further research.
(拙訳)
何が2000年代の住宅循環を引き起こしたのだろうか? 本稿は、誘導型の実証や構造モデルなど、20年間の研究を総合する。しばしば論争が生じていたものの、各研究の時間、場所、手法、測定を考慮すると、この分野の研究は首尾一貫している。循環は個別の局面で生じていたパーフェクトストームだった。1990年代後半から、ファンダメンタルズが改善して、自動化された査定と金融規制緩和により所得分布全体で信用供給が増加した。2000年代前半、金利低下後に証券化クレジットとサブプライムクレジットがさらに拡大したが、その起源は未だに論争の的となっている。こうした一連のショックは持続的なブームを生み出し、それによって考え方の2つの変化がもたらされた。平均的な予想が過度に楽観的になって価格を押し上げ、また、予想が分かれたことで投機を促進した。ブームが崩壊すると、不動産の債務不履行を主因として価格は下がり過ぎ、それによって買い手がいなくなって信用供給が縮小した。これらの力がどのように相互作用し、どのように期待が形成されたかについては、さらなる研究を要する。

崩壊について本文では以下のように書かれている。

The analysis next examines how the bust and eventual rebound further discipline explanations of the boom. One puzzle is what accounts for the apparent overshooting in the bust. None of the five forces behind the boom can explain this: expectations did not overshoot on the downside; interest rates were cut; speculators could not short-sell housing; credit did not tighten below its pre-boom levels due to changes in credit markets; and aggregate income fell less than house prices. Instead, most of the overshooting can be explained by mortgage defaults, which work through two channels: foreclosures create a glut of supply relative to demand, and defaults damage lender balance sheets, contracting credit supply. Declining housing liquidity and overbuilding of durable housing in the boom also played a role. The rebound suggests that many of the shocks that caused the boom were permanent. The bust unfolded in three stages: an initial uptick in defaults and a more gradual price decline from 2006 to 2008 as the temporary shocks that caused the boom began to fade and reverse; a free fall in prices as foreclosures roared in the Great Recession from 2008 to 2010; and a long trough from 2010 to 2012 as improving fundamentals and supportive policies were counterbalanced by persistent defaults.
(拙訳)
分析では次に、崩壊と最終的な回復が、ブームについての説明をさらにどのように検証するかを調べた。一つの謎は、崩壊における明らかな行き過ぎを説明するのは何か、ということである。ブームの背後にあった5つの力のどれもこれを説明できない。予想が下方に行き過ぎることは無かった。金利は下げられた。投機家は住宅を空売りすることはできない。信用市場の変化により、信用がブーム以前の水準まで引き締められることは無かった。総所得は住宅価格ほどは下がらなかった。行き過ぎの大半は不動産の債務不履行によって説明でき、それは2つの経路を通じて働いた。差し押さえは需要に比べた供給の過剰をもたらし、債務不履行は貸し手のバランスシートを痛めて信用供給を縮小させた。住宅の流動性の低下と、ブームにおける高耐久性住宅の建て過ぎも一役買った。回復は、ブームをもたらしたショックの多くが恒久的なものだったことを示している。崩壊は3つの局面で展開した。2006年から2008年に掛けての債務不履行の当初の上昇と、より緩慢な価格の低下は、一時的なショックとして、ブームに陰りが生じて反転する原因となった。2008年から2010年に掛けての大不況においては、差し押さえが頻発し、価格は急低下した。2010年から2012年に掛けての長い谷では、ファンダメンタルズの改善と政策支援が、継続的な債務不履行で打ち消された。

Defaults, liquidity, and overbuilding were not the triggers of the bust—the unwinding of the shocks that caused the boom was. Rather, they explain why prices overshot and stayed persistently low despite improving fundamentals and supportive policy. The timing supports this: foreclosures peaked in 2009, after the largest price declines occurred in 2008–2009, but stayed elevated for years.
(拙訳)
債務不履行、流動性、および建て過ぎは、崩壊のきっかけではなかった。ブームを引き起こしたショックが薄らいだことがきっかけだった。それらが説明するのは、ファンダメンタルズが改善して政策支援があったにもかかわらず、なぜ価格が行き過ぎて持続的に低い水準にとどまったか、である。タイミングがその説明を支持する。債務不履行は、2008-2009年に最大の価格低下が生じた後、2009年にピークを付けたが、何年も高止まりした。

As the Fed raised rates, defaults accumulated, and the mania cooled, house prices peaked in 2006 and began to decline as temporary shocks reversed themselves. When mortgage losses triggered a financial crisis and mass unemployment, a tsunami of defaults drove price overshooting, as foreclosures reduced demand, defaults weighed on lender balance sheets and crimped credit supply, and liquidity in housing markets evaporated. Overly pessimistic expectations do not appear to have played a role in the bust.
(拙訳)
FRBが金利を引き上げると、債務不履行が積み重なり、熱狂は醒め、住宅価格は2006年にピークを付けた後、一時的なショックが反転するにつれて下がり始めた。不動産の損失が金融危機と大量失業を引き起こすと、差し押さえが需要を減らし、債務不履行が貸し手のバランスシートにのしかかって信用供給を妨げ、住宅市場の流動性が蒸発したことで、債務不履行の津波が価格の行き過ぎをもたらした。過度に悲観的な予想が崩壊で役割を演じたようにはみえない。

以下は結論部。

The 2000s housing boom and bust stands out in the history of housing prices and rents in the United States as an anomaly, remarkable for its size, scope, and macroeconomic impact. Two decades of research show that it resulted from a confluence of factors, with all the usual suspects acting together to create a housing cycle greater than the sum of its parts. Indeed, this article shows that many—though not all—apparent disagreements in the literature stem from studying different time periods or places, and that the literature as a whole reveals a cycle that emerged in distinct, mutually reinforcing stages. While many important questions remain, our enhanced understanding of this cycle should help us better diagnose and respond to future housing booms.
(拙訳)
2000年代の住宅ブームとその崩壊は、米国の住宅価格と賃貸価格の歴史において異常な出来事として際立っており、規模、範囲、マクロ経済的な影響において特筆すべきものとなっている。20年間の研究が示すところによれば、それは各要因が合わさって生じたものであり、いつもの容疑者全員が一緒に行動することで、部分の総和よりも大きな住宅循環を生み出した。実際、本稿が示すところによれば、この分野の研究における全てではないが多くの意見の不一致が、異なる期間もしくは場所を研究したことから生じており、研究全体としては、相互に強め合った個別の局面において生じた循環を明らかにしている。多くの重要な問題が残されているが、この循環の理解の進展は、今後の住宅循環に対する診断と対応の向上に寄与するであろう。

Gurenの住宅に関する論文は本ブログで、住宅資産効果:長期的視点 - himaginary’s diary、完全な後知恵で見た2000年代の住宅循環:新キンドルバーガー流の見解 - himaginary’s diary、金利はどのように消費に影響するのか? 家計債務と資産価格の役割 - himaginary’s diaryで紹介したことがある(後知恵論文は今回の論文でも参照されている)。
大成長と大恐慌

というNBER論文が上がっている(H/T タイラー・コーエン、ungated版)。原題は「The Great Accretion and the Great Depression」で、著者はHarold L. Cole(ペンシルベニア大)、Stefano Cravero(同)、Jeremy Greenwood(同)。
以下はその結論部。

The Second Industrial Revolution, which unfolded around the turn of the 20th century, ushered in a wave of transformative new products—such as automobiles, motion pictures, and washing machines—alongside groundbreaking industrial processes like the assembly line, the Bessemer steel-making method, and continuous flow techniques in petrochemical production. This surge in technological progress helped fuel the widespread optimism of the Roaring Twenties, which met its end with the onset of the Great Depression.
To understand the dynamics of the Roaring Twenties and the Great Depression, a model is developed that incorporates both product and process innovation. During times when product innovation outpaces process innovation, leading to an abundance of new products, consumption tends to expand on the extensive margin. When new products flood the market, prices are competitively determined and align with the marginal cost of production. As incomes rise, people prefer to explore a wider variety of products rather than simply buying more of the same goods.
By contrast, when process innovation outstrips product innovation, and the introduction of new products slows down, consumption moves along the intensive margin. In this scenario, people buy more of the products they already consume, and they may even reduce the amount of labor they supply. Prices in this case tend to be higher than the marginal cost of production. The way people consume—whether focusing on a wider range of products or consuming more of what they already have—plays a significant role in shaping the broader economy.
The hypothesis proposed here is that when the flow of new product development began to slow in the 1920s, widespread optimism about the future still fueled excessive investment. During this period process innovation outpaced product innovation, investment and GDP rose, while employment declined. This speculative boom, combined with process innovation—where less labor was required to produce the same output—ultimately deepened the impact of the Great Depression. Proof-of-concept simulations supports this hypothesis, lending credibility to the proposed relationship.
(拙訳)
20世紀初頭の前後に展開した第二産業革命は、自動車、映画、洗濯機といった転換的な新製品の波を到来させるとともに、組み立てライン、ベッセマーの鉄鋼製造法*1、石油化学生産における連続フロー技術といった画期的な産業プロセスの波も到来させた。この技術進歩の急伸は、狂騒の20年代の広範な楽観主義を促進するのに一役買ったが、それは大恐慌の始まりと共に終わりを告げた。
狂騒の20年代と大恐慌の動学を理解するために、製品イノベーションとプロセス・イノベーションの両方を折り込んだモデルを開発した。製品イノベーションがプロセス・イノベーションより速く進んでいる時期には、新製品が巷に溢れ、消費は外延的マージンに沿って拡大する傾向がある。新製品が市場に溢れると、価格は競争的に決定され、生産の限界費用に沿ったものとなる。所得が上昇すると人々は、単に同じ商品をもっと多く買うよりも、様々な種類の商品を求めることを好むようになる。
一方、プロセス・イノベーションが製品イノベーションを追い越し、新製品の登場が鈍化し始めると、消費は内延的マージンに沿って動く。このシナリオでは、人々は自分が既に消費している商品をさらに買うようになり、供給する労働量を減らしさえするかもしれない。その場合、価格は生産の限界費用より高くなる傾向がある。人々がどのように消費するか――より幅広い商品に着目するか、それとも既に所有しているものをもっと消費するか――は、経済全般を形作る上で有意な役割を果たす。
ここで提示された仮説は、1920年代に新製品開発の流れが鈍化し始めた時、将来に対する広範な楽観主義が依然として過剰投資を促進していた、というものである。この時期は、プロセス・イノベーションが製品イノベーションより速く進み、投資とGDPが増えた一方で、雇用は減少した。この投機ブームは、同じ生産を生み出すのに必要な労働力が少なくなるプロセス・イノベーションと合わさって、最終的には大恐慌のインパクトを深めた。概念実証シミュレーションはこの仮説を支持しており、提示された関係性の信頼性を高めている。

債務の持続可能性と複数均衡の範囲

というNBER論文をブランシャールらが上げている(ungated版へのリンクがある著者の一人のページ)。原題は「Debt Sustainability and the Range of Multiple Equilibria」で、著者はOlivier J. Blanchard(PIIE)、Pedro Martínez-Bruera(IMF)、Gonzalo Huertas(同)。
以下はその要旨。

We characterize the size of the range of multiple equilibria in sovereign debt markets. We show that the nature of the equilibrium depends crucially on the degree of uncertainty, which we formalize first as uncertainty about primary balances and later as uncertainty about the fiscal feedback rule. For low uncertainty, the range can be large, but it becomes smaller as uncertainty becomes larger. If uncertainty is large enough, the multiplicity disappears: the interest rate is unique and becomes a continuous function of the debt level. The source of these results is that larger uncertainty decreases the effect of the perceived probability of default on the actual probability of default, thus reducing and eventually eliminating the scope for multiplicity. Interpreting the source of an increase in the interest rate in actual situations is difficult, and complicates the use of intervention by central banks.
(拙訳)
我々は、政府債務市場における複数均衡の範囲の大きさの特性を求めた。均衡の性格が不確実性の程度に大きく依存することを我々は示す。その不確実性を我々は、最初は基礎的財政収支に関する不確実性として、次いで財政フィードバックルールに関する不確実性として定式化する。不確実性が低いと、範囲は大きなものとなり得るが、不確実性が大きくなるにつれ小さくなる。不確実性が十分に大きいと、複数性は消える。即ち、金利はユニークとなり、債務水準の連続関数となる。こうした結果をもたらす原因は、不確実性が大きくなると、認識されたデフォルト確率が実際のデフォルト確率に及ぼす影響を減らし、それによって複数性の余地を減らして、最終的には削除することにある。実際の状況において金利上昇の原因を解釈するのは難しく、中銀による介入の利用を複雑化する。

導入部と結論部では以下のようなことが述べられている。

  • 債務水準が低いと、債務は明らかに維持可能である。債務水準が非常に高いと、債務は明らかに維持不可能である。その中間では、複数均衡が生じる債務の範囲がある。
  • ここでは、2つの極端なケースに焦点を当てた。
    • 一つは、投資家が合理的に楽観的であり、低い金利を要求し、債務の持続可能性は高い。これを良い均衡と呼ぶ。
    • もう一つは、投資家が合理的に悲観的であり、高い金利を要求し、債務の持続可能性は低い。これを悪い均衡と呼ぶ。
  • この範囲内では、両均衡が合理的期待均衡であり、経済が良い均衡に留まるか、それとも悪い均衡に遷移するかは大体において経済学者の評価能力を超えている。
  • 中銀は、国債金利の上昇はファンダメンタルズの問題では無く流動性を反映している場合には介入する責務がある。我々の用語で言えば、良い均衡を維持して悪い均衡の出現を防ぐ責務がある。我々のモデルは、それが如何に困難かを示している。
    • 不確実性が低いと、金利上昇は悪い均衡への遷移を反映していて、完全な介入が正当化されるであろう。
    • 中間的な不確実性では、金利上昇は、良い均衡内の遷移と、悪い均衡へのさらなる遷移の両方を反映しているかもしれない。その場合、良い均衡の金利が含意する金利上昇は受け入れるが、それ以上の上昇は受け入れない、とするための部分的な介入は正当化される。
    • 不確実性が高いと、金利上昇は単に良い均衡の変化を反映しているかもしれず、介入は行うべきではない。
  • 今がどの状況で、介入すべきかどうかを評価するのは、良く言って難しい。
  • 政府が十分に強力な財政フィードバックルールを用いると、中銀の業務が容易になる。
    • この場合、良い均衡下では債務は決して発散せず、国債金利の動きは全て悪い均衡への遷移を反映する(ただし、ここではr*が変化していないと仮定しているが、これ自体も危険な仮定である)。そのため、介入は正当化される。
    • この時、フィードバックが強いほど、複数均衡が生じ得る債務の閾値は高くなる。
  • しかし、フィードバックの強度に不確実性があるという現実的な仮定の下では、フィードバックルールが無い時と同じ問題が再び生じる。
    • フィードバック係数の不確実性の程度次第で、金利上昇は良い均衡から悪い均衡への遷移を反映しているかもしれず、あるいは良い均衡と関連する金利上昇と悪い均衡への遷移を反映した金利上昇が組み合わさっているかもしれず、あるいは良い均衡と関連する金利上昇だけかもしれない。ここでもやはり不確実性の程度が非常に重要になる。

ベバリッジアンフィリップス曲線

というNBER論文をサエズらが上げている(ungated版)。原題は「Beveridgean Phillips Curve」で、著者はPascal Michaillat(UCサンタクルーズ)、Emmanuel Saez(UCバークレー)。
以下はその要旨。

This paper develops a Beveridgean model of the Phillips curve. While the New Keynesian Phillips curve is based on monopolistic pricing under price-adjustment costs, the Beveridgean Phillips curve is based on directed-search pricing under price-adjustment costs. Under directed search, prices respond to slack instead of marginal costs. The resulting Phillips curve has three properties that match recent US evidence. First, it delivers the divine coincidence: inflation is on target whenever unemployment is at its efficient level—the full-employment rate of unemployment (FERU), the geometric mean of the unemployment and vacancy rates. Second, it is decreasing and convex in the unemployment-inflation plane: inflation responds more strongly to unemployment when the labor market is inefficiently tight than when it is inefficiently slack. The convexity is inherited from the Beveridge curve, which makes unemployment a decreasing and convex function of tightness. Third, shifts of the Beveridge curve move the FERU and therefore shift the unemployment-inflation Phillips curve. The model also implies that the Fed's dual mandate is internally consistent, that a soft landing from an inefficiently tight labor market is possible, and that the zero lower bound is not topsy-turvy.
(拙訳)
本稿はフィリップス曲線のベバリッジアンモデルを構築した。ニューケインジアンフィリップス曲線は価格調整費用の下での寡占的な価格付けに基づいているが、ベバリッジアンフィリップス曲線は価格調整費用の下での方向付けされた探索*1の価格付けに基づいている。方向付けされた探索においては、価格は限界費用ではなくスラックに反応する。その結果としてのフィリップス曲線には、近年の米国の実証結果に適合する3つの特性がある。第一に、聖なる一致をもたらす。即ち、失業率が効率的水準――失業の完全雇用率(FERU)、失業率と欠員率の幾何平均――にある時には常にインフレは目標を達成している。第二に、失業率-インフレ平面において減少し、凸である。即ち、労働市場が非効率的に遊休状態にある時よりも非効率的に逼迫している時の方がインフレは失業率により強く反応する。この凸性はベバリッジ曲線から引き継いだものであり、それによって失業率は逼迫度の減少凸関数となる。第三に、ベバリッジ曲線のシフトはFERUを動かし、従って失業率-インフレフィリップス曲線をシフトさせる。モデルはまた、FRBの二つの使命が内的に整合していること、非効率的に逼迫した労働市場からの軟着陸が可能であること、ゼロ金利下限が逆さまの世界*2ではないことを含意している。

MichaillatとSaezの共同論文は本ブログでは今さらIS-LMのミクロ的基礎付け? - himaginary’s diary、マクロ経済安定化のための政府購買の最適利用 - himaginary’s diary、効用関数に資産を入れたニューケインジアンモデル - himaginary’s diary、ベバリッジ的失業率ギャップ - himaginary’s diary、u* = √uv - himaginary’s diaryで紹介したことがあったが、いずれも今回の論文で参照されている(FERUはu* = √uv - himaginary’s diaryで導出したものであり、ゼロ金利下限に関する洞察は効用関数に資産を入れたニューケインジアンモデル - himaginary’s diaryを参照している)。

*1:Directed Search: A Guided Tour | NBERでは「directed search」を次のように説明している:
「This essay surveys, consolidates and extends a relatively recent and, we think, a particularly interesting branch of the field called directed, or competitive, search.
Consider any two-sided market with, e.g., buyers and sellers, firms and workers, borrowers and lenders, or men and women. They are trying to get together, usually in pairs, but sometimes multilaterally. Traditional search theory typically assumes the agents meet bilaterally and at random, although whether a meeting results in matching (trading or forming a relationship) can be endogenous, especially when there is heterogeneity. Directed search is different because agents have information to target their search towards particular types, or sometimes particular individuals, in the market. Moreover, traditional search models usually assume the terms of trade are determined by bargaining, or some related mechanism, after agents meet. Competitive search is again different because the terms of trade — prices, or more generally, contracts or mechanisms — are announced or posted in advance to attract agents on the other side of the market.
The label competitive search here means models with two characteristics: (a) the terms of trade are posted by agents in advance of meetings; and (b) these terms direct search and hence help determine who meets whom.」

*2:本文では「The uniqueness result means that the model can be used to study ZLB episodes of any duration—even permanent ones. The unique ZLB solution is a normal slump: tightness is below its efficient level, unemployment is above the FERU, and inflation is below target. Comparative statics remain normal as well. A negative aggregate demand shock—a further decrease in the taste for consumption a—shifts the ˙ θ = 0 nullcline inward (from figure 9A to figure 9B): tightness falls, unemployment rises, and inflation falls. Demand shocks operate at the ZLB just as they do in normal times.
This behavior is entirely different from the New Keynesian model, in which the ZLB is “a topsy-turvy world, in which many of the usual rules of macroeconomics are stood on their head” (Eggertsson and Krugman 2012, p. 1472). Indeed, when the ZLB lasts long, output and inflation collapse to implausible levels, the model admits no solution with a permanent ZLB, and policies acquire extraordinarily large effects (Michaillat and Saez 2021b). None of these anomalies arise here. The difference comes from wealth in the utility function, which keeps aggregate demand well defined even under an interest-rate peg—and the ZLB is nothing but a peg at zero.」と記述している。cf. 東日本大震災がクルーグマンの間違いを証明した? - himaginary’s diary。

各国間の所得格差の説明再訪

というNBER論文が上がっている(H/T タイラー・コーエン、ungated版)。原題は「Accounting for Cross-Country Income Differences Revisited」で、著者はDavid Lagakos(ボストン大)、Todd Schoellman(ミネアポリス連銀)。
以下はその結論部。

Development accounting offers a simple method for assessing the proximate sources of cross-country productivity differences. Much like decomposing mortality rates into the underlying causes of death, it is a useful diagnostic of which explanations might be most promising for further and deeper inquiry. When Caselli (2005) conducted his influential overview of the literature, he came to the conclusion that much of the development puzzle remained a mystery. Differences in the inputs to production accounted for only a modest share of GDP per worker differences, leaving the bulk to be attributed to differences in TFP, the measure of our ignorance. Caselli also offered some potential avenues for improving our understanding, including studying sectoral results and allowing for non-neutral productivity differences.
Our aim has been to review the state of the literature two decades later. The bulk of this article is dedicated to reviewing the advances and improvements made in measuring the factors of production. It is time to take stock: where does all of this work leave us? As we stressed in Section 2, a benefit of covariance metrics is that they are additive. The information contained in Tables 4–7 can then be combined to reach an assessment. We see two main conclusions. First, on the whole, inputs probably account for a significantly larger share of cross-country productivity differences than previously thought. A plausible range spans 55–70 percent, as compared to 30 percent when using the classic setup and the most recent data. The range reflects three findings: hours per worker are higher in developing countries, deepening the puzzle (-5 percent); broader measures of human capital account for a substantially larger share (58–66 percent); and the contribution of physical capital remains small (7 percent).
The second conclusion is that the plausible range of results remains wide. Each step of the measurement process relies on data and scaling assumptions that deserve further scrutiny. Further, many important dimensions remain challenging to measure. As two leading examples, we have wide ranges of estimates for the importance of public capital and for imperfect substitution across labor types.
We conclude this review with a reminder of the limitations of development accounting. First, development accounting requires external evidence on cross-country differences in production inputs and the importance of those inputs for production. The set of such factors has expanded since Caselli’s review and now includes, for example, firm-embedded productivity. Nonetheless, it remains far from complete, and many interesting and important aspects of growth and development are studied primarily or entirely by methods that fall outside the scope of a review of development accounting.
Second, development accounting only quantifies the proximate sources of cross-country productivity differences. The results covered here suggest the benefits of renewed attention to human capital as a mechanism in the development process, particularly when combined with an endogenous skill bias of technology. Likewise, they point to the potential benefits of modeling the agricultural sector using production functions that deviate from Cobb-Douglas. However, this does not help us disentangle complex causal questions. Even if one accepts that human capital varies significantly across countries, development accounting is not useful for sorting out whether this is the result of culture, parenting, schools, or work. Finally, development accounting cannot speak to the deeper causes of cross-country income differences. Our hope is that this review will be a useful guide to promising model features and mechanisms for subsequent work that takes up these issues.
(拙訳)
開発会計は、各国間で生産性の違いが生じるおおよその源泉を評価する簡単な方法を提供する。死亡率を死因に要因分解するのと同様に、さらに切り込んだ調査にとって何が最も有望な説明かを診断するのに有用である。この分野の研究についてカセリ(2005*1)が影響力のある概観をまとめた時、開発のパズルの多くは謎のまま、という結論に達した。生産への投入の違いは労働者当たりGDPの違いのそこそこの割合を占めるに過ぎず、大半はTFPの違いに帰せられることになったが、それは我々の無知の指標に過ぎない。カセリはまた、我々の理解を改善するであろう道筋も幾つか提示したが、それは部門別の結果の研究や、非中立的な生産性の違いの許容などであった。
我々の目的は、20年後の研究の現状を概観することであった。本論文の大半は、生産要素の測定において達成された進歩と改善を概観することに費やしている。これらの研究すべてが我々をどこまで連れて行ったのか、改めて考えるべき時期に来ている。2節で強調したように、共分散手法の便益は加法的なことにある。表4-7に含まれている情報を組み合わせれば評価につなげることができる。2つの主要な結論が得られた。第一に、総じて、投入はおそらく各国間の生産性の違いの従来考えられていたよりもかなり大きな割合を説明する。従来の設定と直近のデータを使うと30%になるのに対し、可能性が高いレンジは55-70%である。この範囲は次の3つの発見を反映している。発展途上国では労働者当たりの労働時間が長いことで、これは謎を深める(-5%)。人的資本のより広範な指標によってかなり大きな割合が説明できる(58-66%)。物理資本の寄与は小さいままに留まる(7%)。
第二の結論は、結果の可能性が高いレンジは広いまま、ということである。測定過程の各段階は、データと、一層の精査の余地があるスケーリングの仮定に依存している。また、多くの重要な側面が、測定が困難なままである。2つの主要な例として、公的資本の重要性と、労働のタイプの間の不完全な代替性についての推計のレンジが広いことが挙げられる。
本レビューを、開発会計の限界への注意喚起で結びたい。第一に、開発会計は、各国間の生産投入の違いと、それらの投入の生産にとっての重要性について、外的な証拠を必要としている。そうした要因の集合はカセリのレビュー以降拡大し、今や例えば企業に埋め込まれた生産性も含まれる。にもかかわらず、それは完全からは程遠く、成長と開発についての多くの興味深く重要な側面が、主に、もしくは完全に、開発会計のレビューの外に属する手法によって研究されている。
第二に、開発会計は各国間の生産性の違いのおおよその原因を定量化するに過ぎない。ここでカバーした結果は、特に技術の内生的な技能バイアスと結び付いた場合の、開発過程におけるメカニズムとしての人的資本に改めて注目することの便益を示唆している。同様にそれは、農業部門をコブ・ダグラスから離れた生産関数を用いてモデル化することの便益の可能性を指し示している。しなしながら、そのことは、複雑な因果の問題を解きほぐす助けにはならない。人的資本が国によって大きく違うことを受け入れたとしても、それが文化、子育て、学校、もしくは仕事の結果であるかどうかを解明する上で、開発会計は有用ではない。さらに、開発会計は各国間の所得の違いの原因のより深い原因について語ることはできない。そうした問題に取り組む今後の研究にとって、本レビューが有望なモデルの特性とメカニズムへの有用な指針となることを望む。