前回エントリで紹介したギャニオンらによる“本当に曲がっているフィリップス曲線”を、別のやり方で示した豪州準備銀行の表題の論文を少し前にMostly Economicsが紹介していた。論文の原題は「Is the Phillips Curve Still a Curve? Evidence from the Regions」で、著者は同行のJames BishopとEmma Greenland。
以下はその要旨。
The way in which wages respond to very low rates of unemployment remains a key source of uncertainty in Australia, partly due to the lack of historical evidence to draw upon. To help fill this gap, we study data on unemployment rates and wages growth across local labour markets over the past 20 years. The considerable variation in economic conditions across local labour markets allows us to infer the strength of the relationship between unemployment and wages growth (i.e. the wage Phillips curve) at very low unemployment rates that are rarely seen at the national level. We find strong evidence that the wage Phillips curve is indeed a curve, rather than a straight line. When the unemployment rate exceeds 7½ per cent, the Phillips curve is flat and wages growth is unresponsive to changes in unemployment. Wages growth then becomes increasingly responsive to changes in the unemployment rate as the unemployment rate falls to lower and lower levels, most notably below 4 per cent. These findings have implications for monetary policy, particularly at the current juncture given the Reserve Bank of Australia's central forecast for the unemployment rate to fall to multi-decade lows in the next few years.
(拙訳)
失業率の非常に低い水準に賃金がどのように反応するかはオーストラリアでの不確実性の主要な要因になっているが、その理由の一部は参照すべき過去の実証データが存在しないためである。この穴を埋めるため、我々は過去20年間以上に亘る各地域の労働市場の失業率と賃金伸び率のデータを調べた。各地域の労働市場の経済環境が著しく異なることは、国レベルでは滅多に見られない非常に低い失業率での失業率と賃金の伸び率の関係(即ち賃金フィリップス曲線)の強さを推定することを可能にする。我々は、賃金フィリップス曲線が実際に直線ではなく曲線であるという強い証拠を見い出した。失業率が7.5%を超えるとフィリップス曲線は平坦になり、賃金伸び率は失業率の変化に反応しなくなる。失業率がどんどん低下していくに連れ、賃金伸び率は失業率の変化にますます反応するようになるが、もっとも顕著なのは4%以下においてである。以上の発見は金融政策にとって意味を持つ。とりわけ、オーストラリア準備銀行の失業率の中央予測値が今後数年で数十年来の低い水準に低下すると見通している現時点においてはそうである。
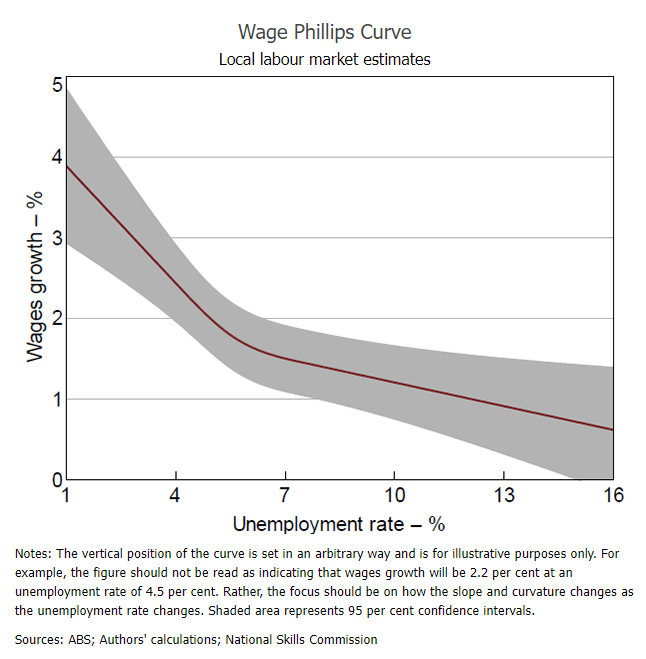
以下はノンテクニカルサマリーに掲載されている図。