という論文をタイラー・コーエンが「重要な研究(important work)」というコメントを添えて紹介している。原題は「Cataloging Growth: A Re-Evaluation of 1900–1990」で、著者はVerónica Bäcker-Peral(MIT)、Benjamin Wittenbrink(同)。
以下はコーエンが「有用(useful)」と評価した著者の一人による連ツイでの解説。
Excited to share our new working paper: how much did the US standard of living really rise over the twentieth century — and when? With @bhwittenbrink
Using 5.1 million Sears catalog listings, we build a quality-adjusted price index for consumer goods, 1900–1990. Two headline findings: growth was much larger than official statistics imply, and its peak came before WWII, not after. (1/9)
To understand changes in living standards over long periods, it's essential to properly measure changes in prices. According to national data, nearly half of average annual nominal GDP growth in the US over the twentieth century is attributed to changes in the cost of living alone! (2/9)
This is hard for two reasons. Historical price data are limited — Gordon (1999) called 1914–1947 "the black hole where little is known." And product quality changed enormously. If better products are treated as simply more expensive, measured inflation is too high and real growth too low. (3/9)
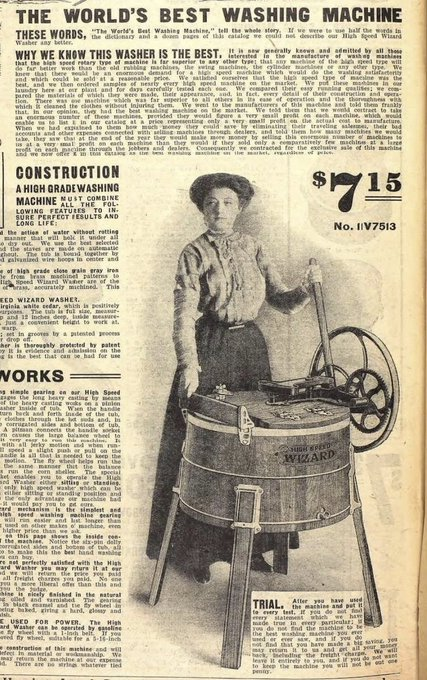
Our data: we digitize a nearly complete run of Sears catalogs from 1900–1990, yielding 5.1 million product listings.
For each listing, we recover prices and detailed descriptions of materials, dimensions, features, warranties, and more. (4/9)
Method: we use those descriptions to estimate annual hedonic price schedules — what would the same bundle of product characteristics have cost one year later?
This lets us construct a quality-adjusted price index across a broad range of consumer goods. (5/9)
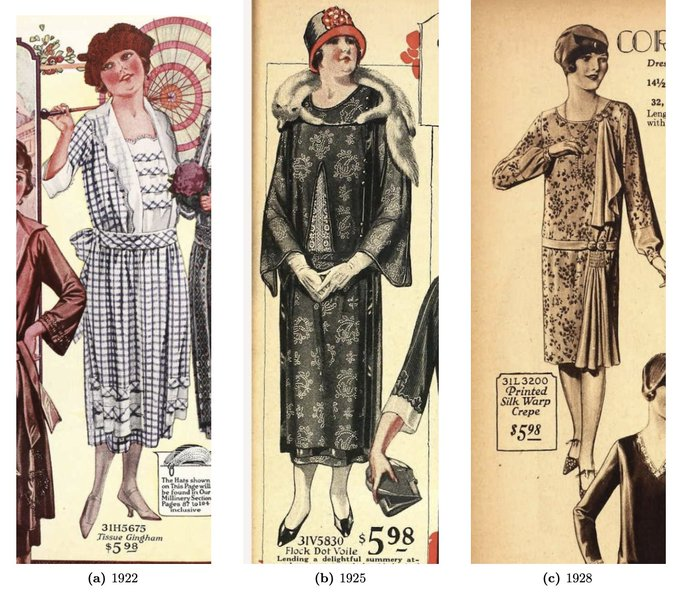
What does quality change look like?
For $5.98, Sears sold a gingham dress in 1922; a silk-and-wool dress with embroidered sleeves in 1925; and an all-silk dress with a more ornate cut in 1928.
The sticker price never moved. The product transformed. (6/9)
First main result: quality improvements account for roughly half of the cumulative rise in unadjusted goods prices, and conventional deflators track sticker prices, not quality-adjusted prices.
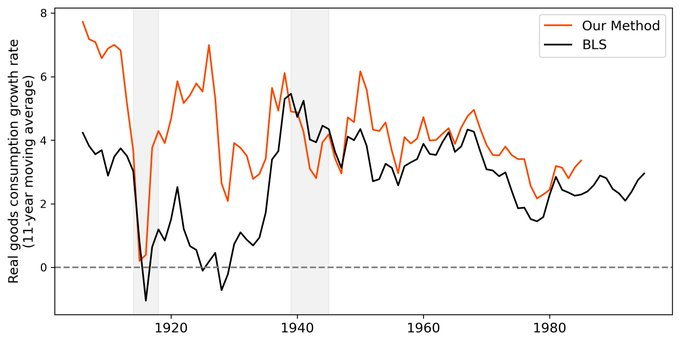
Standard deflators imply real goods consumption grew 10.3x from 1900–1990. Our index implies 39x. (7/9)
Second main result: the timing of growth reverses. The conventional view puts the peak of US growth in the postwar "golden age" — but that view rests on price data from exactly the black-hole period.
We estimate real goods-consumption growth of 5.4%/yr in 1900–1939 vs 4.2% in 1946–1983 (existing estimates: 2.0% and 3.1%). Productivity shows the same reversal. (8/9)
Quality did not always rise. During the Great Depression, quality fell 7% as Sears shifted toward cheaper goods: silk vanished from apparel and curtains became two feet shorter — the "trading down" pattern theory predicts. (9/9)
Paper: https://veronicabp.github.io/website/VBP_BHW_CostOfLiving.pdf
Comments welcome!
(Grok翻訳を適宜修正)
新しいワーキングペーパーを共有できることに興奮している:20世紀に米国の生活水準は実際どれほど上昇したのか――そして何時上昇したのか? @bhwittenbrink との共著。
510万件のシアーズのカタログ目録を利用して我々は、1900–1990年の消費財の品質調整済み価格指数を構築した。2つの主な発見:成長は公式統計が示唆するよりもはるかに高く、そのピークは第二次世界大戦後ではなく戦前だった。(1/9)
長期間にわたる生活水準の変化を理解するためには、価格の変化を適切に測定することが不可欠だ。全国データによると、20世紀の米国における平均年間名目GDP成長率のほぼ半分は、生計費の変化だけに帰せられる! (2/9)
これは2つの理由で困難である。歴史的な価格データは限られている――ゴードン(1999年*1)は1914~1947年を「ほとんど何も知られていないブラックホール」と呼んでいる。そして、製品の品質が劇的に変化した。より優れた製品を単により高価なものとして扱うと、測定されたインフレ率が高過ぎ、実質的な成長率が低過ぎることになる。(3/9)
我々のデータ:我々は1900年から1990年までのシアーズカタログのほぼ完全なシリーズをデジタル化し、510万件の商品リストを生成した。
各リストについて我々は、価格と、素材、寸法、特徴、保証などの詳細な説明を復元した。(4/9)
方法:我々はこれらの記述を用いて、年間のヘドニック価格の推移を推定した――同じ製品特性の束が1年後に幾らになっていただろうか?
このようにして、幅広い消費財に亘る品質調整済み価格指数を構築することができた。(5/9)
品質の変化とはどのようなものか?
5.98ドルに対し、シアーズは1922年にギンガムのドレスを販売した。1925年には刺繍の施された袖付きのシルクとウールのドレスを販売し、1928年には、より華やかなカットのオールシルクのドレスを販売した。
表示価格は一度も変わらなかった。商品が変革したのだ。(6/9)
最初の主要な結果:品質向上は、調整前の商品価格の累積的な上昇の約半分を占める。そして従来のデフレーターは、品質調整済み価格ではなく表示価格を記録する。
標準的なデフレーターは、1900–1990年に実質財消費が10.3倍に成長したことを示唆する。私たちの指数は39倍を示唆する。(7/9)
第2の主な結果:成長のタイミングが逆転する。従来の見解では、米国の成長のピークを戦後の「黄金時代」に置いている――だが、その見解はまさにブラックホール期間の価格データに依存している。
我々の推計では、実質財消費成長率は1900–1939年に年間5.4%だったのに対し、1946–1983年は4.2%であった(既存の推定値:2.0%および3.1%)。生産性も同様の逆転を示す。(8/9)
品質は常に上昇していたわけではない。大恐慌の間、シアーズはより安価な商品へとシフトしたため、品質は7%低下した:衣類やカーテンからシルクが消え、カーテンは2フィート短くなった――これは「トレーディング・ダウン」パターンの理論が予測する通りである。(9/9)
論文: https://veronicabp.github.io/website/VBP_BHW_CostOfLiving.pdf
コメント歓迎!